Structure the market
Built a Databricks claims-intelligence framework across 3B+ records.
SELECTED WORK / 02 / Doral Health & Wellness
I translated claims intelligence into choices about service lines, referral corridors and strategic accounts, separating market opportunity from demand the organization could serve.
Business Account Executive · 2025

THE CONSTRAINT
The central problem was allocation under imperfect information. Claims could identify where care occurred, but they could not alone establish patient willingness, referral influence, payer participation or receiving capacity. My work connected that market evidence to a finite field plan and the service-line decisions required to make its opportunities addressable.
INSIDE THE ORIGINAL PRESENTATION
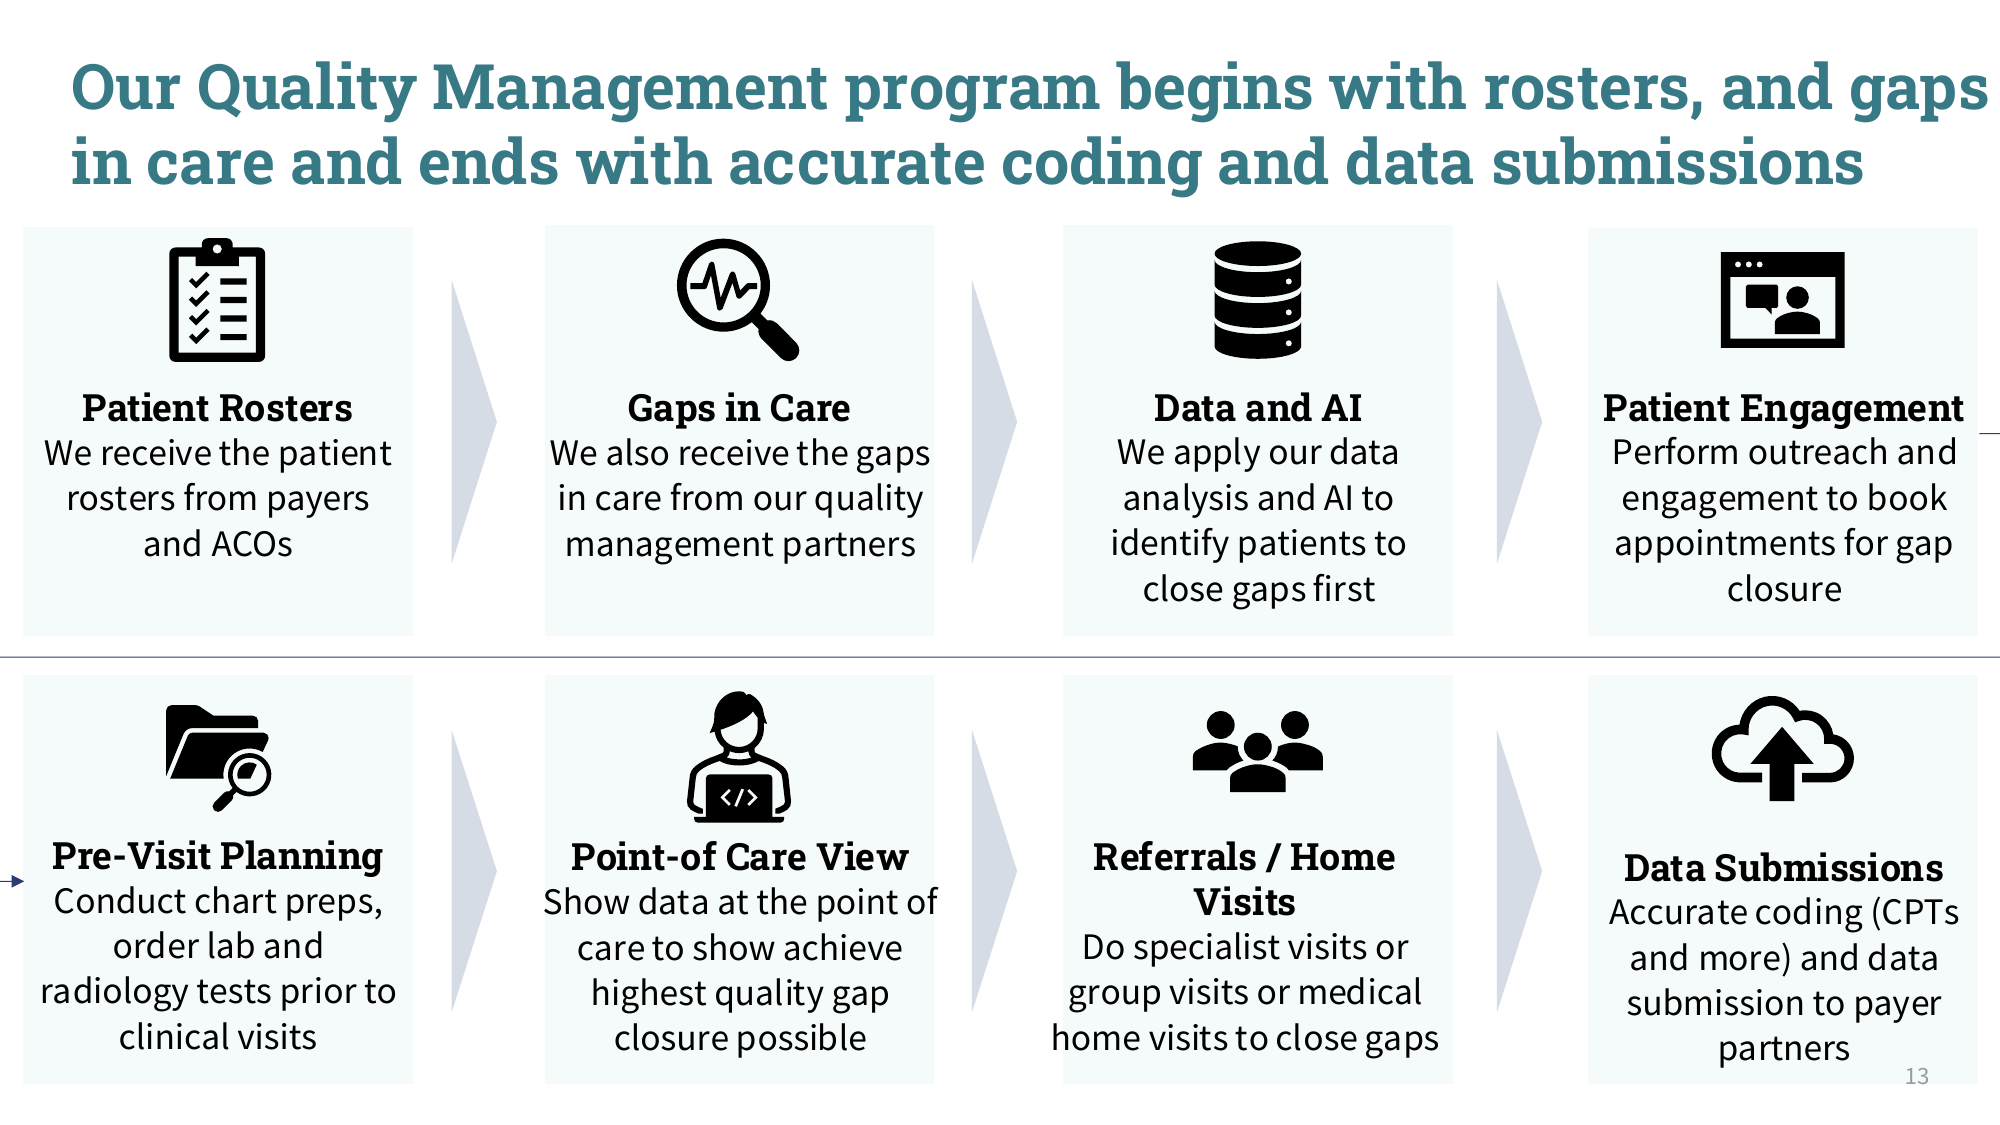
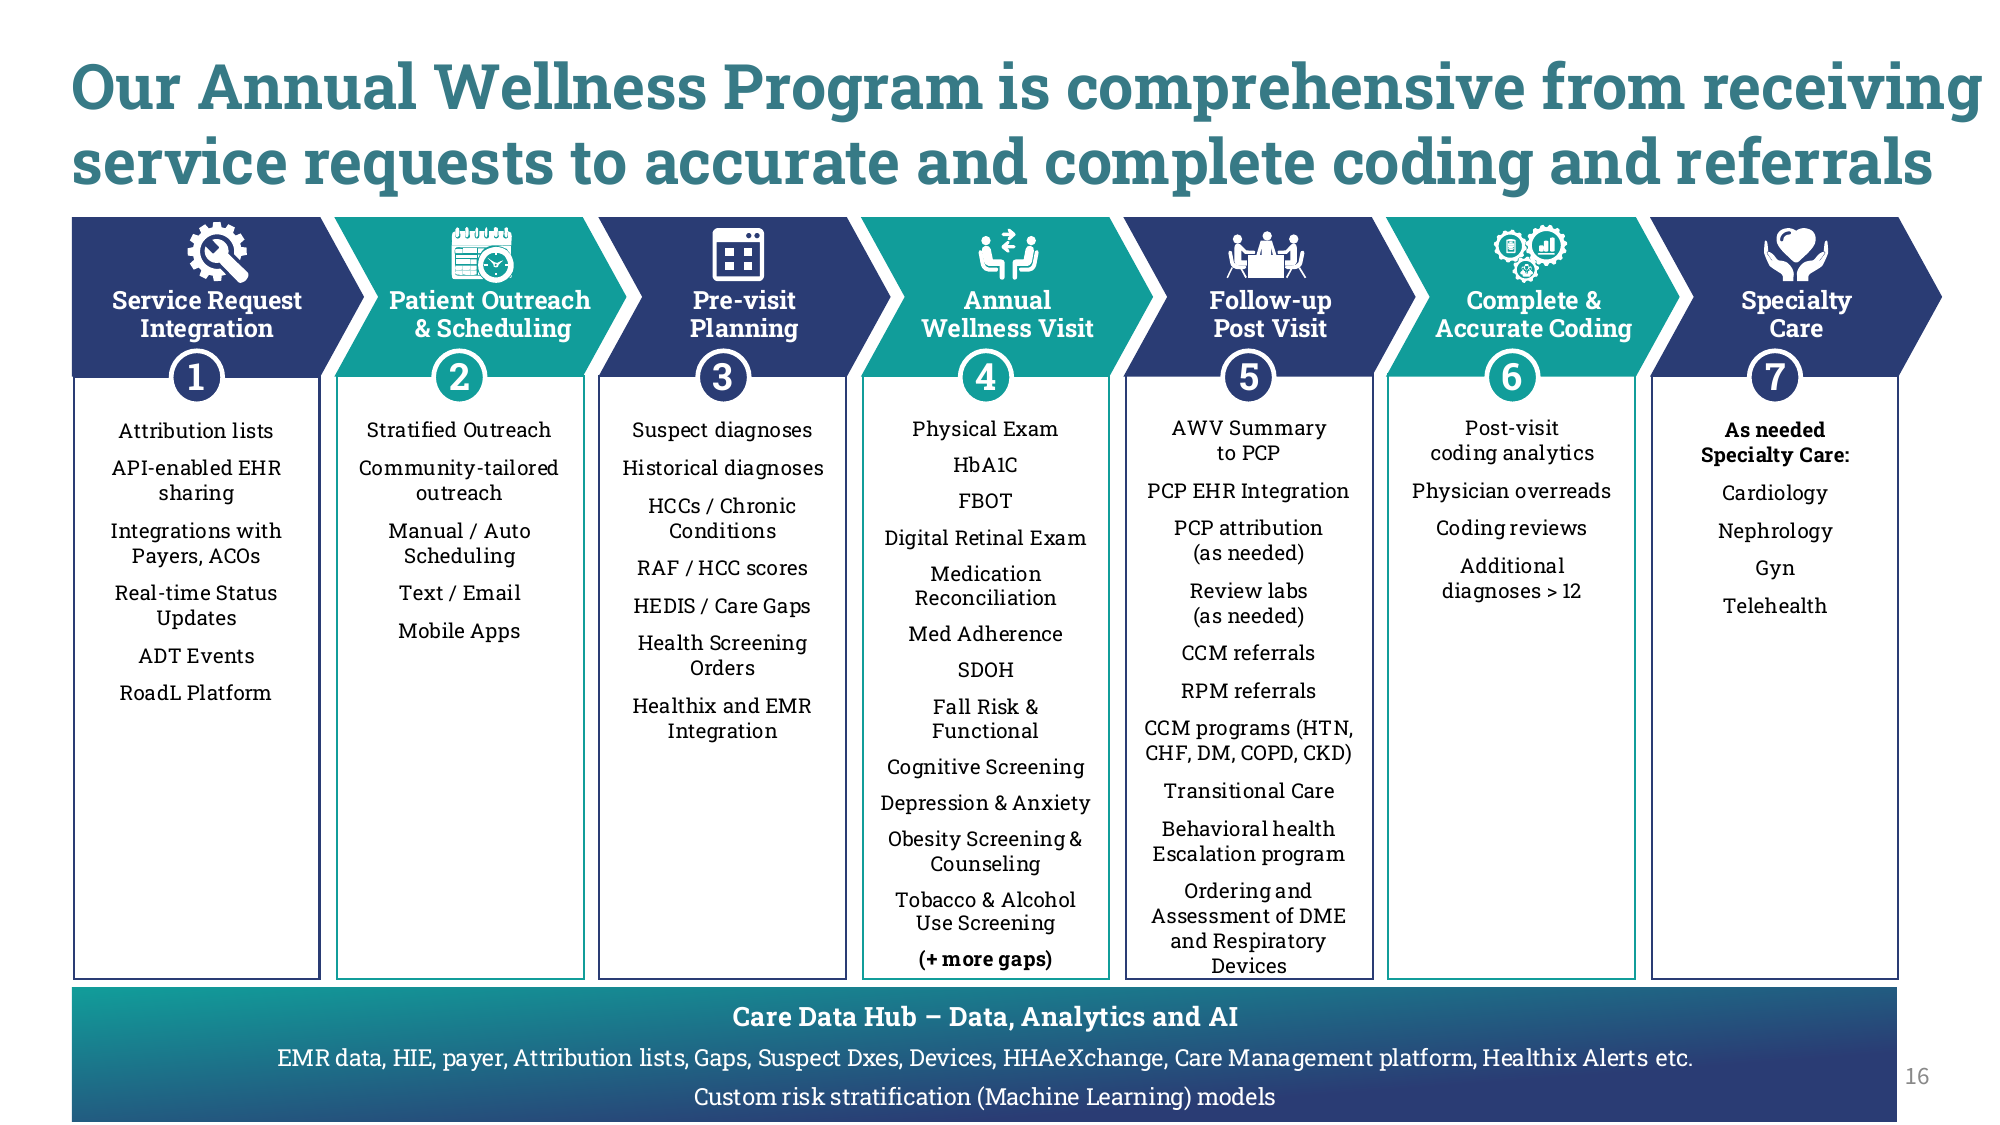
The historical Doral / RoadL presentation makes the operating design inspectable: who enters the workflow, what happens next, and how the record returns to the payer.
MY OPERATING READ
A prioritization model is only one part of the design. Outreach, chart preparation, clinical capacity, follow-up, and coding each need to receive enough context to complete the next step.
The leadership question is where that continuity breaks—and who has the authority to repair it.
TRACE THE EIGHT-STAGE DESIGN
We receive the patient rosters from payers and ACOs.
The operating starting point is an attributed population, not a generic lead list.
Annual wellness: Service request integration → Patient outreach & scheduling → Pre-visit planning → Annual wellness visit → Follow-up post visit → Complete & accurate coding → Specialty care.
Source: my historical Doral / RoadL presentation, pages 13 and 16. Original slide design and wording are preserved. The material documents program design; it does not independently verify deployment completeness, clinical benefit or the reported financial and growth outcomes. The commentary above is my operating interpretation.
WHAT I BUILT
Built a Databricks claims-intelligence framework across 3B+ records.
Translated leakage, procedure utilization, geography, and provider relationships into account and network strategy.
Supported negotiation and implementation of $3.2M+ value-based agreements and service-line capacity decisions.
Designed RoadL and HouseCalls growth architecture linking home-based services to health plans, ACOs, IPAs, hospitals, and provider groups.
REPORTED OPERATING OUTCOMES
STRATEGIC INTERPRETATION / AZIS R. DABAS
The executive value of a data asset is the set of decisions it changes. Here, the relevant decisions concern which demand to pursue, which services to support and which relationships justify scarce field and clinical resources.
A leakage estimate describes care flowing through a market. It does not establish that the organization can or should capture every dollar. The next layer is addressability: geography, payer participation, patient needs, referral behavior and available service capacity.
I would treat the modeled $125.9M leakage opportunity as the beginning of a prioritization process. The decision is which portions survive an operational and economic screen, then which small set can support a credible execution plan.
The documented work connects claims analysis, provider targeting, value-based agreements and home-based care design. Those inputs belong in a shared allocation discussion so analytics, sales and service-line leaders can weigh the same opportunities and constraints.
I would compare opportunities by the contribution available after acquisition and delivery costs, the capacity they consume and the uncertainty that remains. A high-volume corridor may require a service the organization cannot yet staff; a smaller corridor may use existing capacity and collect sooner. Those alternatives belong in one capital discussion, with explicit reasons for pursuing, sequencing or declining each opportunity.
The original Doral presentation shows a path from attributed rosters and care gaps to outreach, visit preparation, care, follow-through and coding. It makes the dependency visible: a better targeting model cannot create value if the next team cannot act on its output.
My operating interpretation is to assign an owner and an observable completion event to each handoff. The management review should ask where eligible demand is being lost, what blocks progression and whether the proposed fix improves the journey rather than moving work elsewhere.
Before expanding a priority corridor, I would test whether the targeted population can be reached, accepted and served, and whether the resulting services produce an attractive contribution after delivery and acquisition costs. The comparator must be defined before a result is interpreted.
Modeled leakage, downstream lifetime-value estimates, contracted value, patient activation and collected revenue belong in different columns. Keeping them separate improves the investment decision: leadership can see which assumptions have advanced and which still require evidence.
This analysis explains the strategic implications of the operating record. Forward-looking decision tests describe how I would evaluate a mandate today.
Read the wider strategic perspective$125.9M is modeled leakage, $22M is an estimated downstream lifetime-value opportunity, and $240K is identified savings—not realized cash. The 4,000 figure describes activated patients, not physicians.
Read the source résuméContinue the analysis
Related executive analysis examines the operating choices raised by this case. These essays extend the argument; they are not independent validation of the reported results.
Test the economic assumptions in the decision labs →FROM THE OPERATING RECORD TO THE WIDER SYSTEM